The debugger is one of the most essential features of WebStorm.
With WebStorm you can debug all kinds of applications written in JavaScript, TypeScript or Dart: Node.js, React Native and Electron apps and, of course, client-side apps written using different frameworks. In addition to that, you can also debug unit tests and build scripts.
One of the main benefits of using a debugger inside the IDE is that you put the breakpoints and step through your actual source code (even if you then compile it. Thank you, source maps!). If you want to edit the code or quickly navigate to the usages or definitions of methods while debugging, you don’t need to switch back to the editor.
And no matter what kind of code you debug, your experience with the debugger will be the same.
To see how the debugger works in WebStorm, we’ll try to debug a simple Express Node.js application. We’ll start with creating a new run/debug configuration. Then we’ll put in some breakpoints, see what’s going on in the Debugger’s Variables view, step through the code, evaluate expressions and use the interactive console.
Prepare for debugging: create a run/debug configuration
Run/debug configuration is an entry point to, as the name suggests, running and debugging apps in WebStorm.
To debug different types of apps and files, you need to use different types of run/debug configurations.
Depending on the type, the information you need to provide in the configuration varies.
For example, in the Node.js configuration, you need to specify a file that needs to be run. In the test configuration you can select between the name of a suite, test or a test file. Some configurations attach to the already started app, in this case, you need to specify the URL and port to attach to.
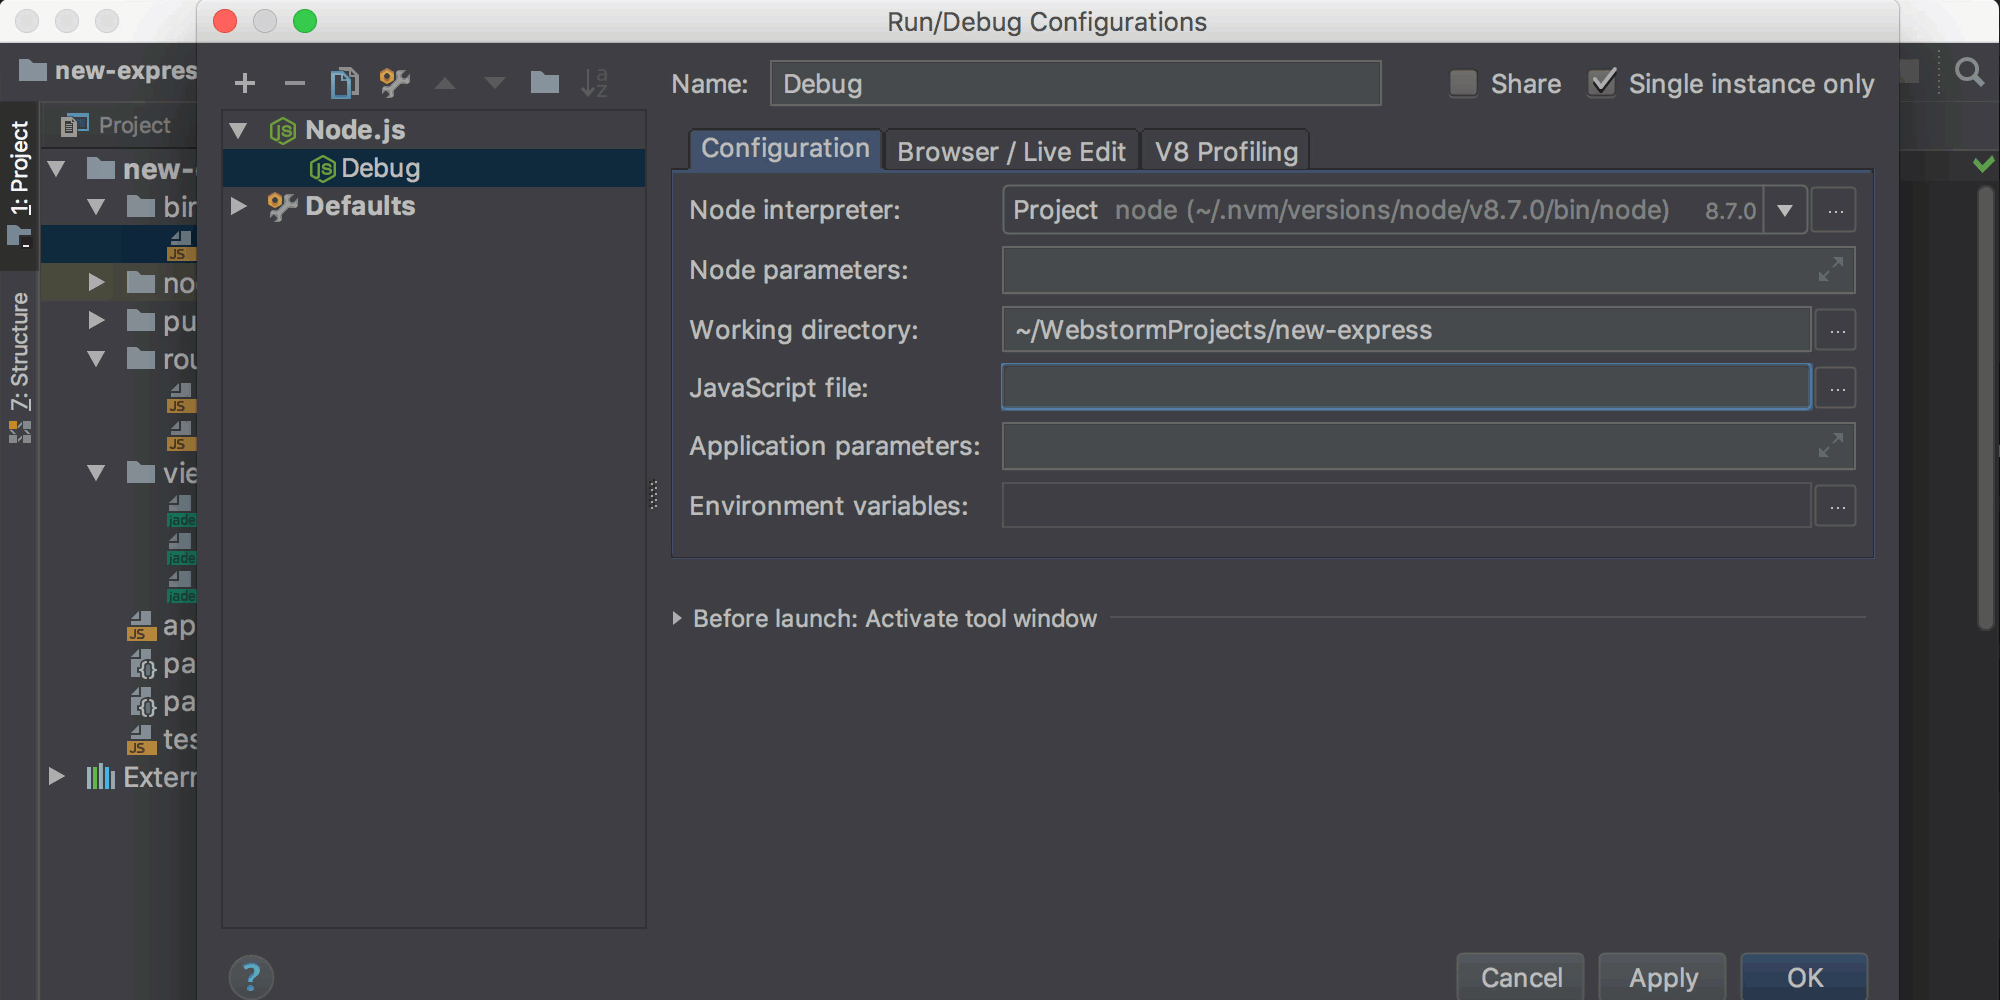
To create a run/debug configuration:
- Click on the drop-down menu in the top right corner of WebStorm and select Edit configurations…
- Click on the + icon and select the configuration type: we select Node.js.
- Add the missing information about the debug environment: we need to specify the main file that runs our app.
- Name and save the configuration
All the created configurations are saved in the workspace.xml file in the .idea folder in the root of your project so that you can reuse them next time you open this project.
If you want to share your configuration with your team, check the Share checkbox in the configuration and then commit the .idea/runConfigurations folder to the version control.
Starting debugger
Once we have our configuration ready, select it in the drop-down list and hit the green debug icon (the one with the bug on it).

Our Node.js configuration will run the file we’ve specified in it in a debug mode. Many configurations will do the same, but some other will instead attach the debugger to the already running app.
In our case, we could have actually started a debugger without creating a configuration beforehand. Instead, we could have right-clicked on the JavaScript file in the project view or the editor and selected Debug or pressed Ctrl-Shift-D or Ctrl-Shift-F9 on Windows and Linux.

This creates a temporary configuration that, if you want to reuse it, you can save later in the Edit configurations dialog (temporary configs are greyed out).

Debug tool window
We can now see a new Debug tool window at the bottom of the IDE – it’s a control panel for everything related to debugging.
On the left side of it, there are the icons for stopping and re-running our configuration.
The Debug tab with Frames and Variables view as well as the stepping icons on top will be activated when the app is stopped on a breakpoint (we’ll talk about it in a moment).

The Console tab shows the messages logged by the app as well as error messages, but we can also use it to evaluate expressions.
The Scripts tab lists all the files loaded into the currently running process. We can double-click on the file to see its content in the editor.
Adding breakpoints to pause the code
Now we want to see what’s going on in our app at a specific point. With the breakpoints, we can pause the app when a specific line of code is executed and then look at the application state: what variables are now available and what their values are.
Let’s put a breakpoint on a line in which our demo app handles the GET request: click next to the line number in the editor, and you will see a red circle, a breakpoint.

(Here’s the content of the file on this screenshot)
If you click on a breakpoint again, it will be removed. You can additionally configure how the breakpoint works if you right-click on it. For example, you can add specific conditions when the breakpoint will be hit.
We can add and remove breakpoints any time during the debug session or before it. There’s no need to restart the debugger after we’ve set or cleared a breakpoint!
Exploring the app state and call stack
So now, when the debugger is up and running, and we have a breakpoint in our code, let’s stop on it. For that we should do the actions that will trigger the code with the breakpoint: in our case, we need to open a URL like http://localhost:3000/en in the browser.
Now the Debug tool window is full of content. Let’s have a look at it!
On the right, we see the state of our application – all the local and global variables available at this point and their values. We can also see the values right in the editor: at the end of the lines of code or if we hover over a variable.
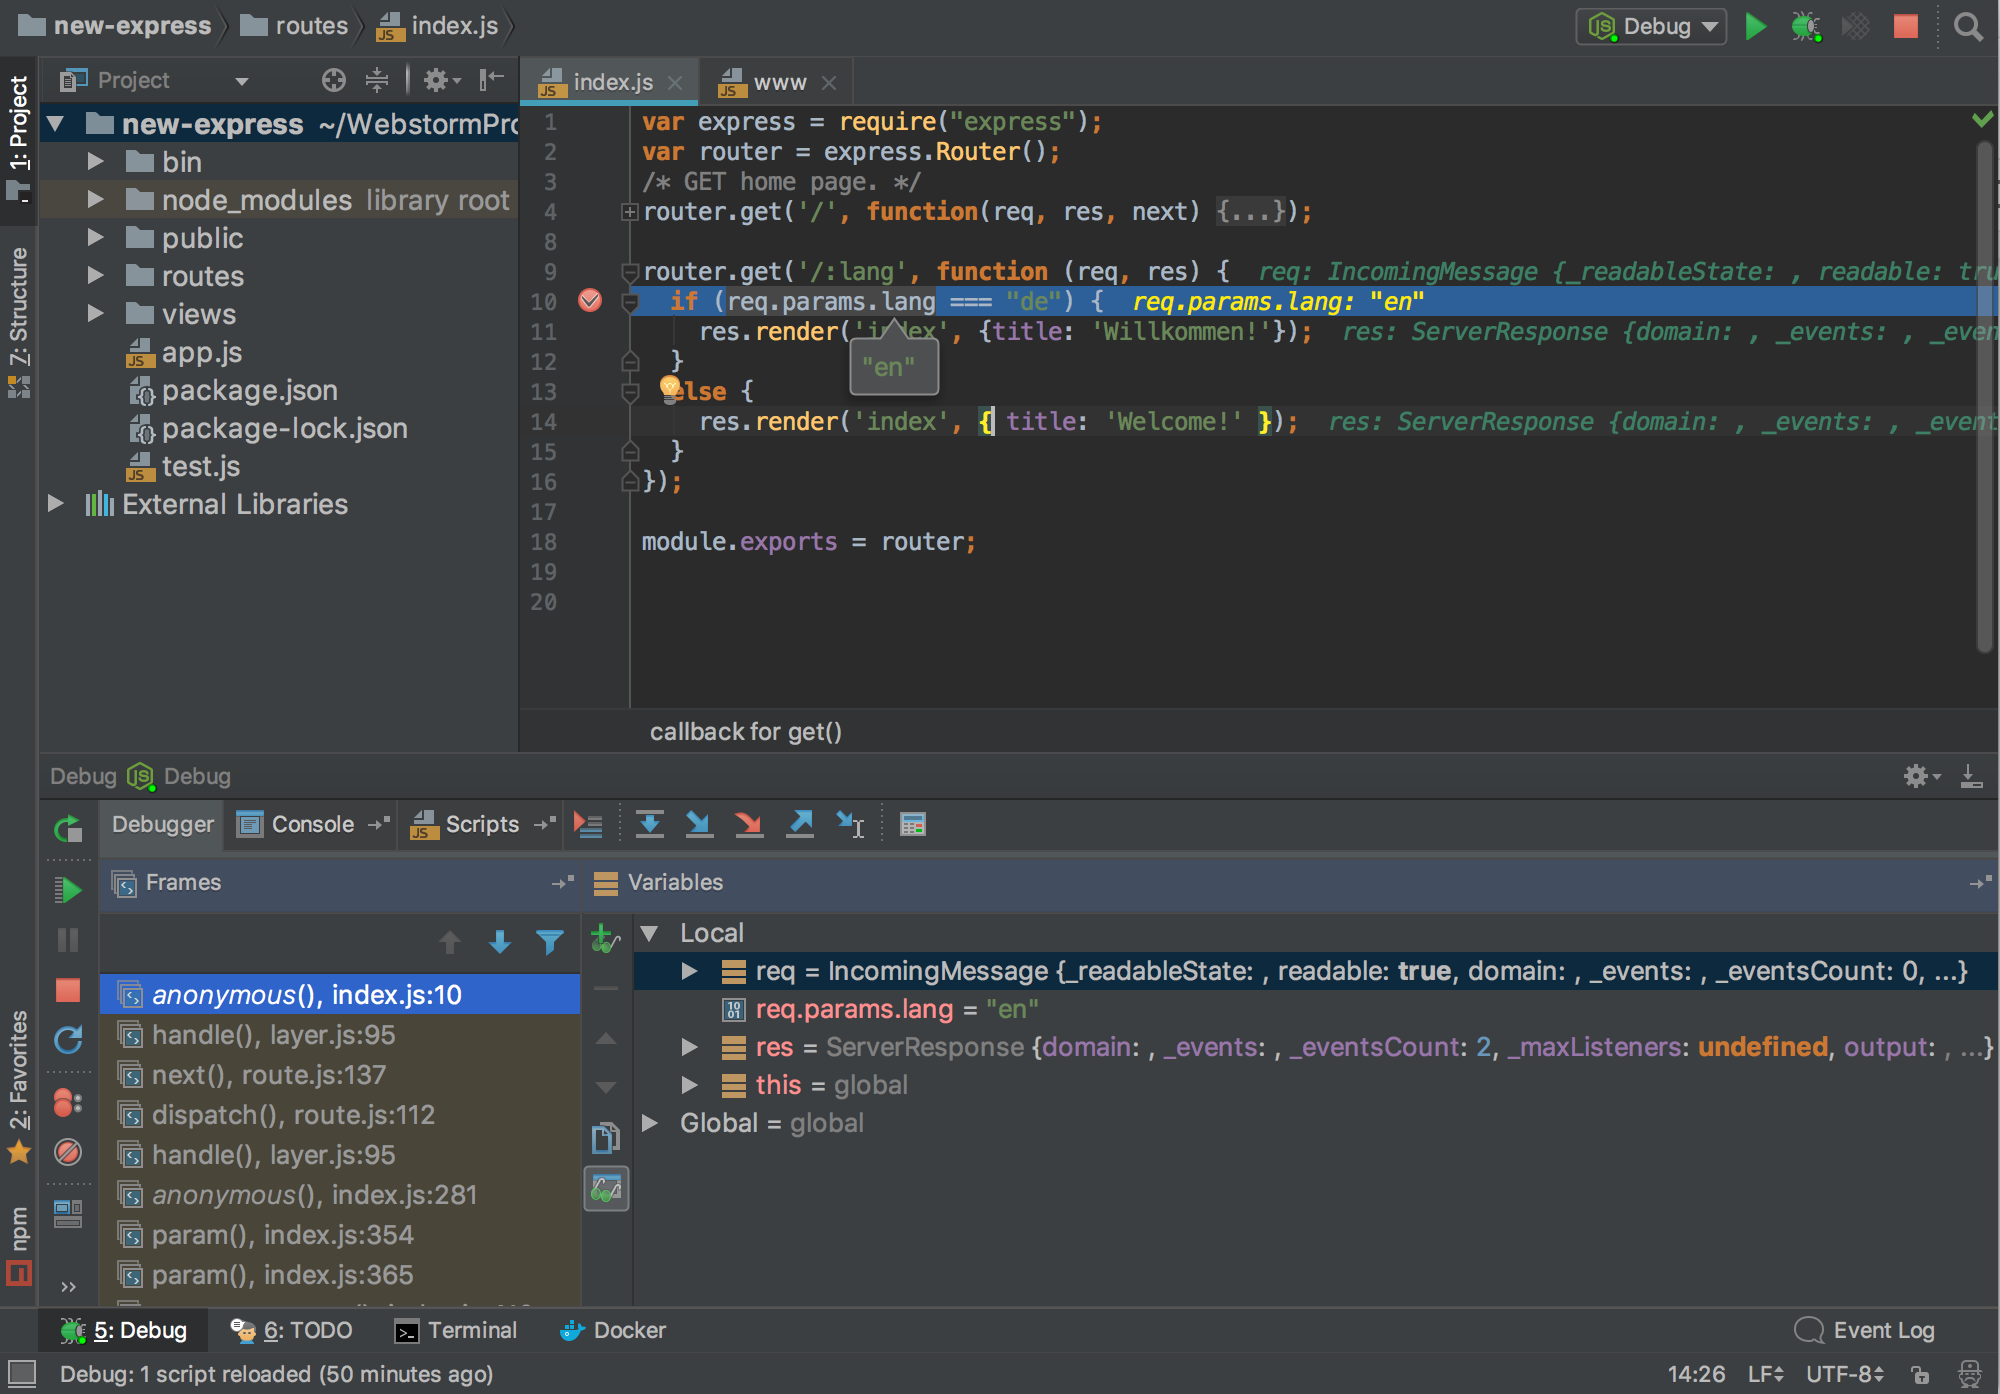
The Frames view shows the call stack – a list of all the methods that have been executed to get the execution to the code with the breakpoint, in reverse chronological order. If we go through the frames, we will see the applications state at every point of the execution path.
Don’t forget that the code under the breakpoint has not yet executed. So if you introduce a variable in this line, you’ll see it in the variables view, but it will still be undefined.
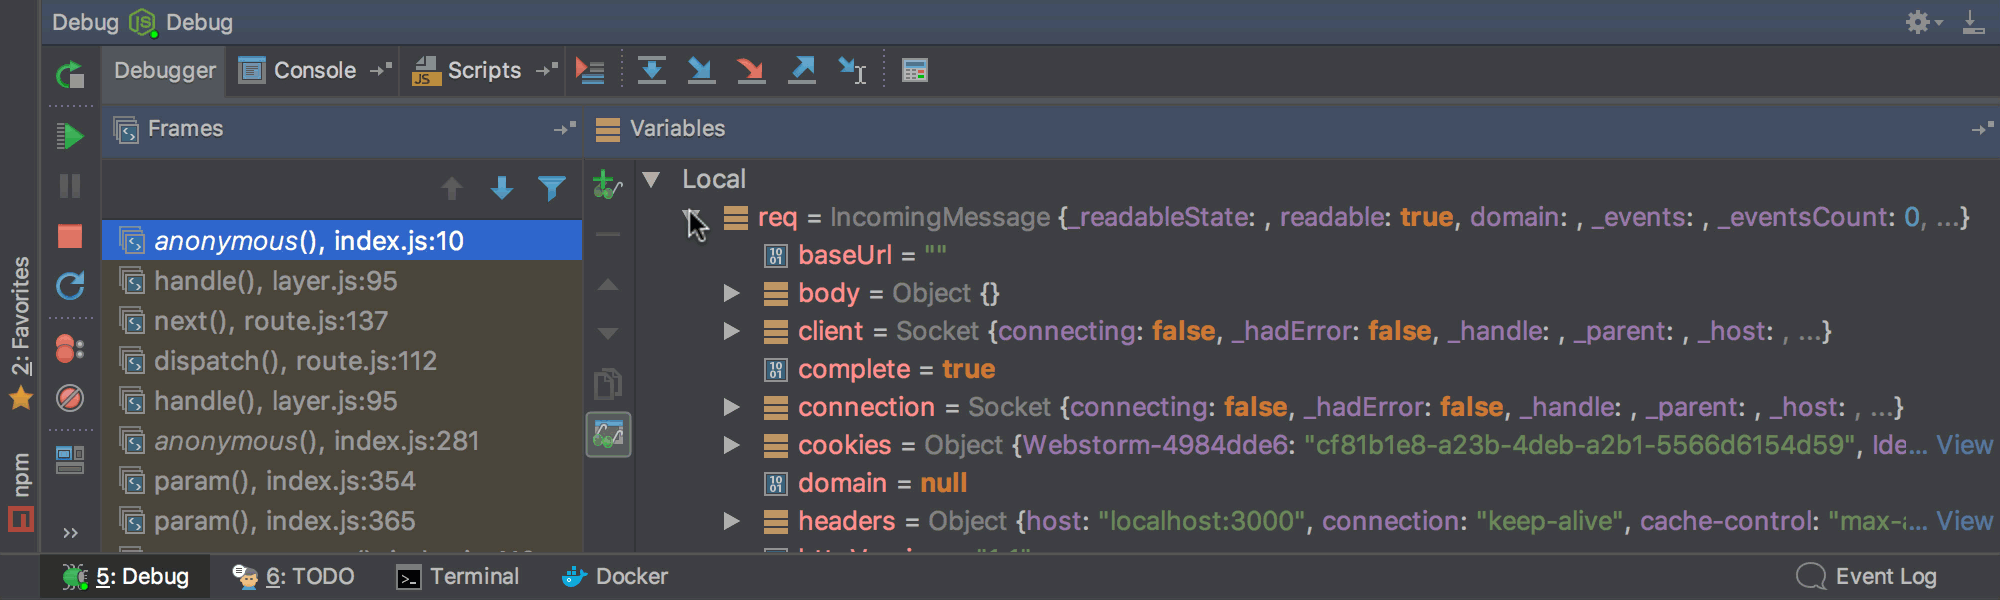
In the Variables view, we can expand the objects and arrays to see their content.
We are specifically interested in the params object that contains the parameters of the request. We can type its name to find it in the list (note that it will search only through the expanded nodes). Let’s add it to Watches – that way we will always see its value on the top of the Variables view anytime we stop at a breakpoint.
Now press the Resume button on the left to continue the execution of the program.
Stepping through the code
If we want to get a better understanding of how our code is executed, we, of course, can put lots of breakpoints in our code and then move from a breakpoint to a breakpoint by resuming the execution, but there’s a better way to do that – we can step through the code!
The stepping actions are available on the top of the debug tool window, and they are activated when the breakpoint is hit.
Step over action (F8) will move the execution in the current file, line by line, without stepping into any function calls.

In our example, if we hit it once, it will check the condition in line 10 and then stop on the statement in the else block because the condition was false.
With Step Into (F7), we will step to the next executed line in this or another file. So if it’s a function call, it will jump to its definition and stop at the first line.
By default, WebStorm will not step into the source code of JavaScript, Node.js or dependencies in the node_modules folder of your project. But if you want to step into them, you can use the Force Step Into action (you can uncheck Do no step into libraries in Preferences | Build, Execution, Deployment | Debugger | Stepping).
Step Out (Shift-F8) will finish the execution of the current function and then stop at the next statement after the call.
If we want to skip some lines, but then stop on some other line that is not yet executed, we can either put a new breakpoint on this line and press Resume, or we can put a cursor in it and use the Run to Cursor action. That’s a much more efficient and easier way than setting and clearing breakpoints whenever you move the cursor.
Evaluate Expression
The Variables view shows the values of objects when the app is stopped on a breakpoint. But what if we want to check the value of an expression? Say, we want to see if a condition in the if statement is true or false before we step over to the next line.
There are three ways to do that:
The first way is to type this expression in the Debug Console. For that, we can simply type it, copy and paste it, or select it in the editor and use the Evaluate in Console action.
The second way is to select the expression and then use the Quick Evaluate Expression action: the result will appear next to it in a tooltip.
And the third way is to invoke the Evaluate Expression popup. Similar to the console, you can type (with the help of code completion) and evaluate any statement it is in.

The pros of using the Evaluate Expression popup compared to the console are that you can open it using a shortcut (
Alt-F8) and then see the fill information about the returned object in a handy tree view.

So now we know enough to debug an application: we can stop the app on a breakpoint, see the application state, step through the code and evaluate expressions. All that works the same way in WebStorm no matter what kind of app you debug.
We have a bunch of blog posts that walk you through creating run/debug configurations for different kinds of apps:
- Client-side applications in general, and specifically
- React apps created with create-react-app
- Angular apps creating using Angular CLI
- Vue.js applications
- Node.js
- React Native mobile apps
- Ionic apps
- Electron desktop applications
We will post more blog posts talking about different debugger features and debugging workflows later this year, but right now you can find lots of useful information in the WebStorm documentation.
The WebStorm team


